
Market Snapshot Regions FAQ Service AreasCall 647-879-0484Market Report · July 2026Southern Ontario Real Estate: Balanced to Buyer-Leaning"Prices remain below July 2025 levels across most

Dated: August 18 2026
Views: 27
"Prices remain below July 2025 levels across most markets, while new listings decline. Buy smart. Sell strategically. Think long term." — Mani Verma
Not uniformly. The region was broadly balanced to buyer-leaning, but "buyer's market" can't be applied evenly. Buyers had the most leverage on overpriced, dated or long-sitting listings, while well-priced entry-level and family homes in supply-tight pockets still attracted competition. GTA new listings fell 17.8% year over year, meaning active buyers had fewer fresh choices than a year earlier — even as prices stayed below 2025 levels.
A more balanced market, with improving buyer affordability, thinner new-listing activity, and early signs that price declines may be moderating.
The Bank of Canada held its overnight policy rate at 2.25% on July 15, 2026, noting weak but improving economic growth and inflation expected to ease toward roughly 2%.
| Market | July sales | Annual sales change | Avg./benchmark price | Annual price change | Supply |
|---|---|---|---|---|---|
| GTA | 5,995 | ▼ 0.9% | Average: $1,003,956 | ▼ 4.5% | 4.6 months |
| Waterloo Region | 582 | ▼ 10.0% | Average: $706,240 | ▼ 3.8% | 3.9 months |
| Cornerstone markets* | 1,518 | ▼ 11.3% | HPI varies by area | Down in all major markets | 4.6 months |
*Cornerstone's broader reporting area spans Hamilton, Burlington, Mississauga, Waterloo Region, Haldimand, Niagara North and Norfolk. Its July total fell 11.0% from June and 11.3% from July 2025.
Still negative almost everywhere — but the monthly trend looks steadier than the annual number suggests.
In the GTA, the seasonally adjusted HPI composite ticked up from June, and Cornerstone's benchmark prices slipped only modestly month over month across most markets — a signal that the pace of decline may be leveling off.
Tap a region to see July sales, average prices and where buyers found the most room to negotiate.
Toronto stayed the GTA's busiest municipal market. Its average price sat above the GTA-wide figure, reflecting a concentration of central, higher-density housing in established neighbourhoods.
Note: a simple average can be skewed by the mix of homes sold in a given month — the MLS HPI is the better tool for tracking constant-quality price trends.
Mississauga's Cornerstone HPI benchmark landed at $924,400, down 3.0% month over month and 5.6% year over year — one of the sharper monthly slips among major Cornerstone markets.
Peel stayed attractive to buyers for its access to Toronto employment centres, a deep supply of condos and townhouses, established detached-home neighbourhoods, and more moderate pricing than much of York and Halton. For sellers, differentiation was the deciding factor: dated interiors and ambitious pricing competed directly against newer, better-presented listings.
| Aurora | $1,301,811 |
| Markham | $1,107,537 |
| Newmarket | $885,625 |
| Vaughan | $1,125,840 |
| King | $2,028,099 |
Aurora, King and parts of Vaughan and Markham remained York's highest-priced pockets. Newmarket and parts of East Gwillimbury were comparatively more affordable, though lot size, housing age and commute strongly influenced value. The best buyer opportunities tended to be homes with realistic sellers and manageable renovation needs — not simply the areas with the largest headline declines.
| Ajax | $907,336 |
| Clarington | $753,919 |
| Oshawa | $693,677 |
| Pickering | $951,065 |
| Whitby | $894,776 |
Durham kept drawing buyers priced out of Toronto, York and Halton. Oshawa and Clarington posted the lowest average prices, while Pickering commanded a premium for its Toronto access. Durham wasn't an automatic bargain, though — buyers needed to weigh older homes needing capital work against newer subdivisions with higher taxes and maintenance costs, and factor in transit and secondary-suite potential.
| Oakville | $1,412,619 |
| Burlington | $1,151,595 |
| Halton Hills | $1,050,887 |
| Milton | $968,388 |
Oakville stayed the region's premium market. Milton offered a lower entry point, though buyers needed to factor in property taxes, embedded development charges and future competing supply from new construction. Burlington's HPI benchmark of $874,200 (down just 2.8% year over year) pointed to more resilience than several neighbouring markets, supported by established neighbourhoods and waterfront amenities.
Hamilton's HPI benchmark sat at $673,900 (down 6.0% year over year); Burlington's was $874,200 (down 2.8%). Across Cornerstone's broader reporting markets, new listings fell 15.0%, inventory dropped 9.6%, and average days on market rose to 38 from 36 a year earlier.
Hamilton offered a wider spread of price points than Burlington — downtown, the west mountain, Stoney Creek and outlying areas all behaved differently depending on condition, lot size and commute. Renovated homes, legal duplexes and well-located family properties outperformed dated or overpriced listings. Note: Brantford isn't part of this HPI table, so its figures shouldn't be extrapolated from Hamilton's.
| Kitchener — 244 sales | $677,423 (−3.7%) |
| Waterloo — 130 sales | $737,043 (−2.3%) |
| Cambridge — 142 sales | $670,068 (−7.8%) |
Waterloo Region ran noticeably softer than the GTA: sales fell 12.2% month over month and 10.0% year over year, new listings dropped 14.3%, and days on market averaged 33. Kitchener led on volume; Waterloo held the smallest annual price decline; Cambridge saw the sharpest drop but kept the most affordable average price. Notably, single-family sales fell only 1.0% year over year while townhouse/condo sales dropped 24.3% — affordability alone didn't guarantee stronger activity.
| GTA · Property type | July sales | Avg. price | Annual price change |
|---|---|---|---|
| Detached | 2,789 | $1,291,690 | ▼ 5.1% |
| Semi-detached | 557 | $964,922 | ▼ 7.4% |
| Townhouse | 1,003 | $817,213 | ▼ 3.9% |
| Condo apartment | 1,564 | $636,323 | ▼ 2.3% |
| Waterloo Region · Property type | July sales | Avg. price | Annual price change |
|---|---|---|---|
| Single-family | 383 | $811,734 | ▼ 5.2% |
| Townhouse/condo | 196 | $502,390 | ▼ 9.5% |
Semi-detached homes saw the GTA's steepest annual decline, while condos held up comparatively better — reinforcing their role as the entry-level ownership segment. In Waterloo, attached housing (5.1 months of supply) faced far more pressure than single-family homes (3.2 months).
The Bank of Canada held its policy rate at 2.25% on July 15. That removed a source of uncertainty but didn't fully restore confidence — mortgage qualification, fixed-rate pricing and household debt still weighed on decisions.
TRREB logged 14,484 new GTA listings (down 17.8%) and 26,098 active listings (down 12.1%), at 4.6 months of inventory. Falling supply can eventually help stabilize prices even while sales stay soft.
Many buyers were waiting on clarity around tariffs, inflation and borrowing costs. Stronger economic or employment data this fall could pull hesitant buyers back in if prices hold steady.
Not uniformly. The region was broadly balanced to buyer-leaning, with real variation by municipality, housing type and price range. Buyers had the strongest position on homes priced above comparable sales, needing repairs, or sitting on the market for weeks — while well-priced entry-level and family homes still saw competition.
Prices remained below July 2025 levels across the GTA, Hamilton and Waterloo Region. That said, the GTA's seasonally adjusted benchmark price edged up from June, suggesting the pace of annual declines may be moderating.
A lower price doesn't automatically make a home affordable once you factor in down payments, mortgage stress-test rules, property taxes, insurance and condo fees. Many buyers were also waiting for more clarity on tariffs, inflation and borrowing costs before committing.
Cambridge (−6.3%), Hamilton (−6.0%), Mississauga (−5.6%) and Kitchener-Waterloo (−5.5%) posted the largest annual HPI declines. Among GTA housing types, semi-detached homes fell the most, down 7.4% year over year.
It depends on the goal: Oshawa and Clarington for the lowest average GTA pricing, Toronto and Peel condos for the easiest entry point, Durham and Waterloo for buyers wanting more space, and Cambridge, Hamilton and Mississauga for the largest year-over-year price adjustments.
It can be, for buyers with secure income, a long holding horizon, and financing that stays comfortable under a higher-rate stress test. Prices sat below 2025 levels with more choice than during the pandemic years, particularly in Waterloo's attached-housing segment and several GTA suburbs.
Selling made sense when the move was necessary and the home was priced against current comparable sales rather than peak-market expectations. Preparation, presentation, timing and pricing mattered far more than the reputation of the municipality alone.
The most likely near-term path is stabilization rather than a sharp rebound or a broad collapse.
"July's conditions reward process and analysis rather than generic optimism."
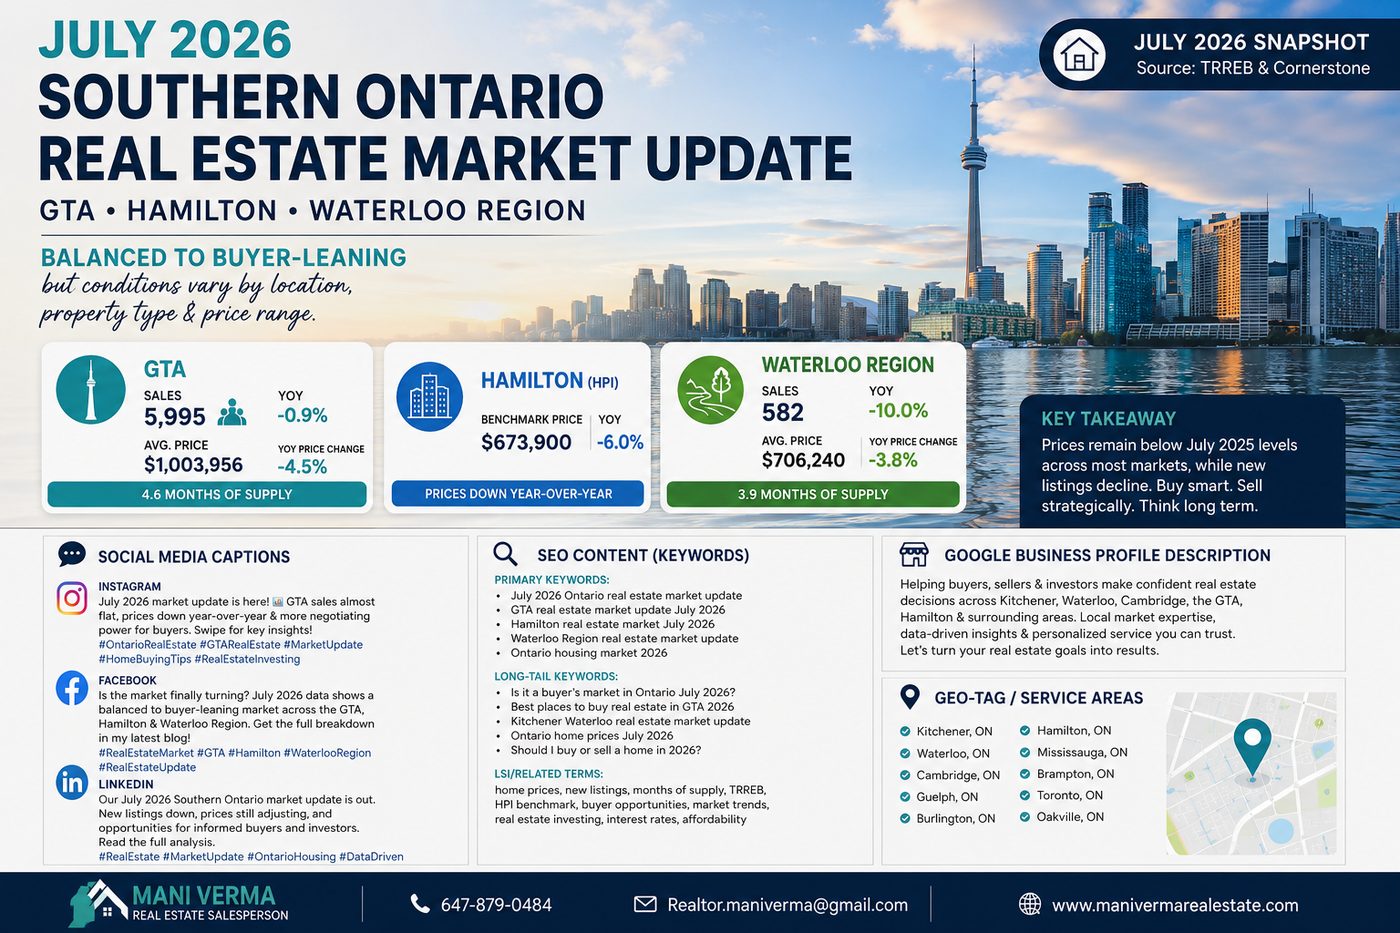
Save or share this snapshot — source: TRREB & Cornerstone, July 2026.
Local knowledge in the GTA, Hamilton-Burlington and Waterloo Region.
Whether you're buying, selling or investing in this balanced-to-buyer-leaning market, get a strategy built around your neighbourhood and your goals.

I’m Mani Verma, a real estate salesperson with Royal Canadian Realty, helping clients buy, sell, and invest across Cambridge, Kitchener, Waterloo, Ayr, and surrounding areas. I’m committed....
Market Snapshot Regions FAQ Service AreasCall 647-879-0484Market Report · July 2026Southern Ontario Real Estate: Balanced to Buyer-Leaning"Prices remain below July 2025 levels across most
May 2026 Market ReportSouthern Ontario Real Estate Market ReportWhat's Really Happening Across the GTA, Hamilton & Waterloo Region — by Mani Verma, Royal Canadian RealtyHome Sales (GTA)5
−4.9% GTA Average Price (YoY) $1,051,969 avg — April 2026+7% GTA Sales Volume (YoY) 5,946 transactions in April5.2 mo National Inventory Near balanced conditions nationallyApril 2026
📊 Market Report · March 2026Southern OntarioReal Estate ReportWhat's Really Happening Across the GTA, Hamilton & Waterloo Region — A comprehensive, data-driven analysis for,

The listing data displayed is deemed reliable but is not guaranteed accurate by CREA®. Data last updated on September 21, 2026 3:01 PM UTC The trademarks REALTOR®, REALTORS®; and the REALTOR® logo are controlled by The Canadian Real Estate Association (CREA®) and identify real estate professionals who are members of CREA®. Used under license. The trademarks MLS®, Multiple Listing Service® and the associated logos are owned by The Canadian Real Estate Association (CREA®) and identify the quality of services provided by real estate professionals who are members of CREA®. Used under license.
Show More...
 Data provided by the Ontario Regional Technology & Information Systems. The information is deemed reliable, but is not guaranteed. Not intended to solicit buyers or sellers, landlords or tenants currently under contract.
The trademarks REALTOR®, REALTORS® and the REALTOR® logo are controlled by The Canadian Real Estate Association (CREA) and identify real estate professionals who are members of CREA. The trademarks MLS®, Multiple Listing Service® and the associated logos are owned
by CREA and identify the quality of services provided by real estate professionals who are members of CREA. Used under license.
REALTOR® contact information provided to facilitate inquiries from consumers interested in Real Estate services. Please do not contact the website owner with unsolicited commercial offers.
Show More...
Data provided by the Ontario Regional Technology & Information Systems. The information is deemed reliable, but is not guaranteed. Not intended to solicit buyers or sellers, landlords or tenants currently under contract.
The trademarks REALTOR®, REALTORS® and the REALTOR® logo are controlled by The Canadian Real Estate Association (CREA) and identify real estate professionals who are members of CREA. The trademarks MLS®, Multiple Listing Service® and the associated logos are owned
by CREA and identify the quality of services provided by real estate professionals who are members of CREA. Used under license.
REALTOR® contact information provided to facilitate inquiries from consumers interested in Real Estate services. Please do not contact the website owner with unsolicited commercial offers.
Show More...
