Market Snapshot Regions FAQ Service AreasCall 647-879-0484Market Report · July 2026Southern Ontario Real Estate: Balanced to Buyer-Leaning"Prices remain below July 2025 levels across most

Dated: June 5 2026
Views: 41
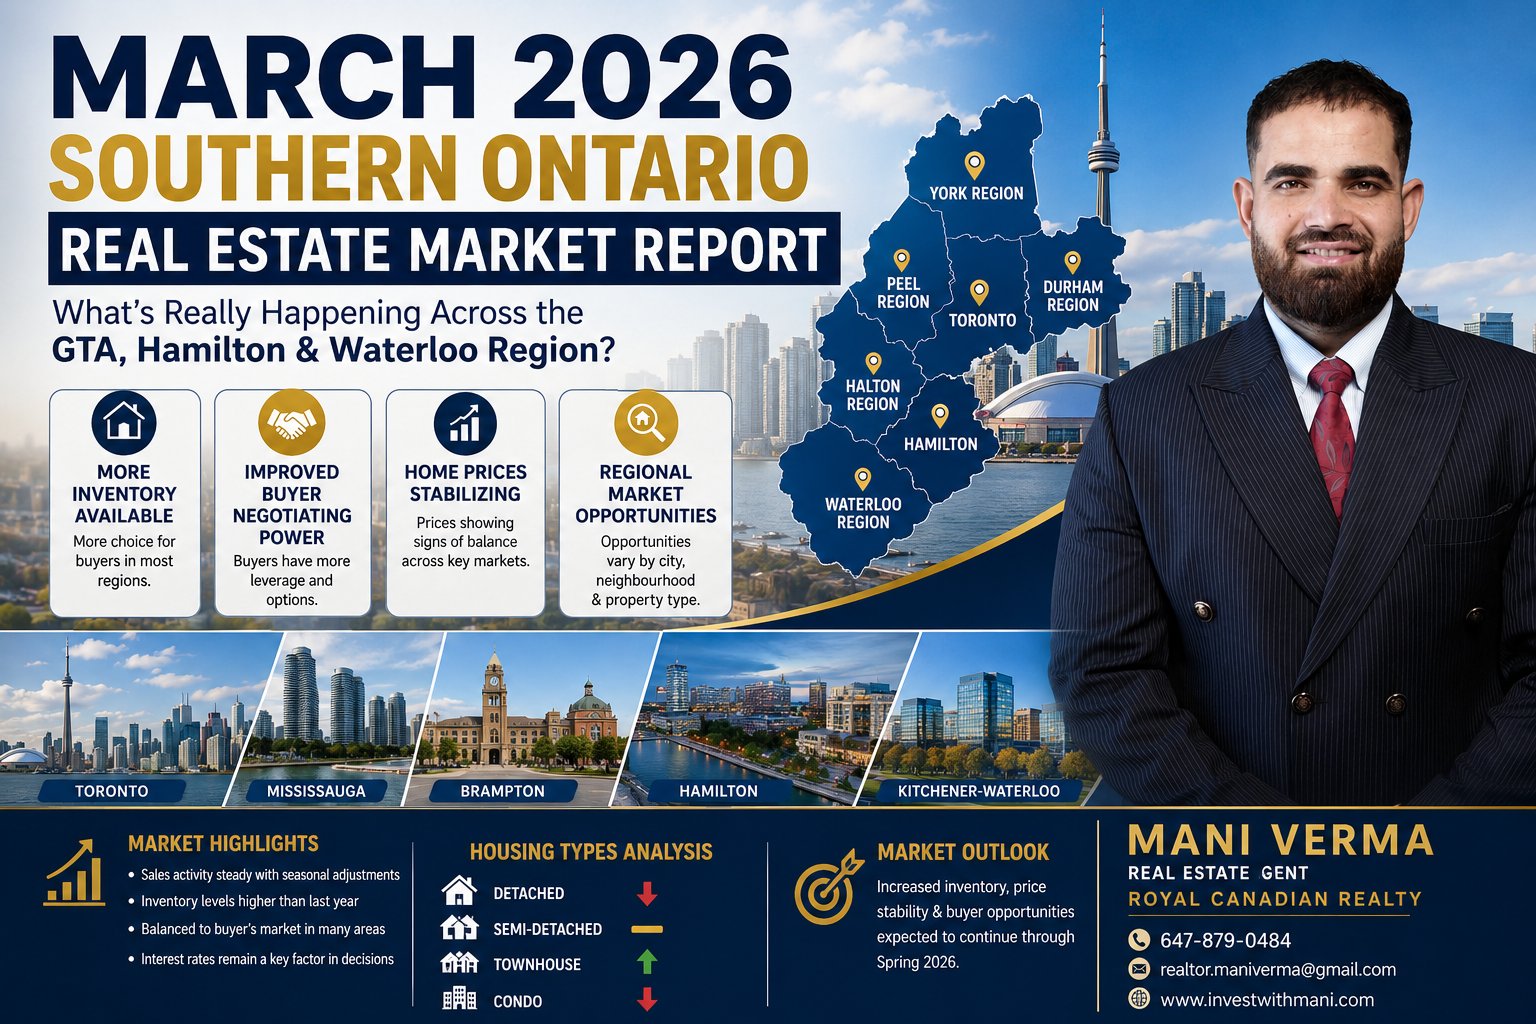
What's Really Happening Across the GTA, Hamilton & Waterloo Region — A comprehensive, data-driven analysis for buyers, sellers, and investors.
Executive Summary
March 2026 delivered a nuanced picture for Southern Ontario real estate. Across the Greater Toronto, Hamilton, and Waterloo Area (GTHWA), the market continues its transition from the pandemic-era seller's market toward broader buyer-side advantage — though the degree varies meaningfully by region and property type.
The headline GTA number — 5,039 sales, up 1.7% year-over-year — marks the first positive annual comparison since September 2025, suggesting cautious spring momentum is building. Yet prices remain well below year-ago levels, giving disciplined buyers meaningful room to negotiate in every major subregion.
The overarching theme: more choice, lower prices, and longer days-on-market are creating conditions not seen since the pre-pandemic years. Those who have been waiting for the right window should pay close attention.
"Buyers continued to benefit from substantial negotiating power on price across major market segments in the last month. However, if market conditions continue to tighten, as they did in March, selling prices could start levelling off as we move through the remainder of 2026."
— Jason Mercer, Chief Information Officer, Toronto Regional Real Estate Board (TRREB)Regional Breakdown
| Region | Avg. Sale Price | Price Change YoY | Sales | Benchmark / HPI | Conditions |
|---|---|---|---|---|---|
| GTA (Overall) | ,017,796 | −6.7% | 5,039 | 41,800 (−7.4%) | Balanced / Buyer-leaning |
| City of Toronto | ~,050,000+ | −5% est. | 1,913 (+0.9%) | — | Balanced |
| 905 Regions (Peel/York/Durham/Halton) | — | −7%+ est. | 3,126 (+2.1%) | — | Buyer-leaning |
| Hamilton Area | 18,456–22,960 | −8.6% to −9.0% | 412–448 | 76,700 (−13.7%) | Buyer-leaning |
| Waterloo Region | 33,258 | −9.6% HPI YoY | 492 | 49,700 (−9.6%) | Balanced (2.9 mo. supply) |
| Kitchener (Q1 avg.) | ~60,000–00,000 | Modest gains Q1 | Leading in volume | HPI −6.7% YoY (Apr) | Balanced |
| Waterloo City (Q1 avg.) | 76,364 | Slight decline | Healthy volume | — | Balanced |
| Cambridge (Q1 avg.) | Notable price gains Q1 | +YoY Q1 | Strong contribution | HPI +1.5% MoM (Apr) | Emerging seller |
Sources: TRREB Market Watch March 2026; Cornerstone Association of REALTORS® March 2026; RAHB/CREA March 2026; WRAR March 2026 stats; Nesto.ca analysis of Cornerstone data.
Toronto’s urban core recorded 1,913 sales in March — a 0.9% year-over-year uptick. The city's condo-heavy mix continues to weigh on average prices, with the MLS HPI benchmark still down year-over-year. Nevertheless, the month-over-month stabilization in the HPI benchmark (+0.3% MoM for the second consecutive month, per TRREB Market Watch data) suggests a floor may be forming. Buyers considering entry-level condos in established downtown neighbourhoods are encountering some of the best affordability seen in years.
The 905 belt outside Toronto delivered the bulk of regional sales, with areas outside the city proper recording 3,126 transactions — up 2.1% year-over-year. Mississauga's lakeside corridor and Brampton's newer suburban subdivisions are experiencing buyer-side leverage, with days-on-market elevated across both municipalities. Detached homes in particular saw a 5.2% GTA-wide sales jump, most of which was driven by buyers entering these more affordable 905 markets.
York Region's luxury and move-up segment is showing signs of selective activity. Markham and Vaughan remain desirable for families seeking larger homes with strong school catchments. Benchmark prices are down meaningfully year-over-year, presenting an opportunity in communities where prices had moved well beyond fundamental value during the 2021–2022 peak. Days on market remain elevated, giving buyers room to negotiate.
Durham continues to attract first-time buyers and investors who've been priced out of Toronto proper. With some of Southern Ontario's more accessible entry-level detached prices, communities like Oshawa and Clarington are seeing steady demand. Price corrections in Durham have been meaningful YoY, creating a compelling window for buyers with long-term horizons.
Burlington and Oakville represent two of the region's most resilient sub-markets. Burlington's lifestyle appeal — a growing downtown, lakefront access, and commuter connectivity — continues to command a premium relative to surrounding communities. Per CREA's Q1 2026 data, the Hamilton-Burlington median for detached homes settled at 84,000, down 5.5% year-over-year, while townhomes corrected to 49,900 (down 6.3%). Apartment units have seen the steepest correction at −8.8% to 45,000.
Hamilton is one of the most striking value stories in March 2026. The average sold price of 18,456 (down 9.04% year-over-year) places the city among Ontario's most corrected markets. With 412 sales — down 11.97% YoY — demand has moderated, but supply has also pulled back (1,004 new listings, down 16.40% YoY). The result is a balanced-but-buyer-leaning market with 1,828 active listings. The average days-on-market of 47 days (up 30.56% YoY) means buyers have substantially more time to conduct due diligence, arrange financing, and negotiate terms. Sellers are receiving 97.2% of list price on average, down 1.2 percentage points.
Entry-level homes with strong commuter access to Toronto or Burlington are moving fastest in the Hamilton market, while higher-end properties and condos are sitting longer.
With 492 MLS sales, 1,082 new listings, and 2.9 months of supply, Waterloo Region sits in balanced territory — though supply remains above the historical average, maintaining buyer leverage. The average sale price of 33,258 and a Kitchener-Waterloo HPI down 6.7% year-over-year (per April CREA stats, reflecting March-into-spring trend) tells the overarching story: prices have corrected but the region's tech-sector employment, university anchors (University of Waterloo, Wilfrid Laurier), and infrastructure investment provide durable long-term demand fundamentals.
Within the region, Cambridge stands out — Q1 2026 data from the Cornerstone Association showed Cambridge notching notable price increases, while Waterloo City recorded the highest average prices at 76,364. Kitchener led in transaction volume. Days on market averaged 34–36 days across property types, reflecting a more active market than Hamilton.
Housing Type Analysis
Biggest sales bump in the GTA — up 5.2% YoY across the region. Hamilton detached median at 84,000 (−5.5% YoY). Best performance relative to other types.
Prices ↓ YoY Sales ↑Stable performance through Q1 2026. More accessible entry point, particularly in Kitchener and Cambridge. Stable transaction volumes with modest price softness.
Stable →Hamilton-Burlington townhouse median at 49,900, down 6.3% YoY. Among the most popular entry-level format in new suburban developments across Waterloo Region.
Demand ↑ Prices ↓Steepest price corrections across most markets. Hamilton-Burlington median at 45,000 (−8.8% YoY). Hamilton condo avg. 24,967 (−6.04%). GTA condo sales up 1.7% YoY.
Prices ↓↓| Property Type | Hamilton-Burlington Median | Change YoY | GTA Sales Change YoY |
|---|---|---|---|
| Single Detached | 84,000 | −5.5% | +5.2% |
| Townhouse / Row | 49,900 | −6.3% | +1.5% est. |
| Apartment / Condo | 45,000 | −8.8% | +1.7% |
| Semi-Detached | N/A | Stable | ~Flat |
Sources: CREA Statistics — Hamilton and Burlington Q1 2026; TRREB Market Watch March 2026; Cornerstone Association of REALTORS®.
Market Drivers
The Bank of Canada's rate cycle through 2024–2025 is still the dominant affordability lever. While rates have moderated from peak levels, they remain a key decision factor for buyers and a constraint on new construction economics.
TRREB CEO publicly warned of the "danger of running dry" in the medium-to-long term housing supply pipeline. Federal and provincial HST and development charge relief announced to spur new home construction — though the "missing middle" housing gap remains unaddressed.
Both TRREB's president and chief information officer cited trade tensions and geopolitical uncertainty as headwinds to consumer confidence in March 2026. Positive resolution could accelerate spring market activity significantly.
New listings in the GTA fell 16.7% YoY to 14,442 — tightening the market even as buyers retain negotiating power. Active listings stood at 21,596 (down 8%), indicating the overall inventory advantage for buyers is beginning to narrow.
Southern Ontario continues to receive a disproportionate share of Canada's immigration intake. Waterloo Region in particular benefits from tech sector immigration tied to the University of Waterloo ecosystem. Long-term demand fundamentals remain intact.
Bill 98 (Building Homes and Improving Transportation Infrastructure Act, 2026) supported by TRREB. Federal and provincial co-ordination on development charges and HST removal on new rental housing are structural supports for the market's medium-term outlook.
Frequently Asked Questions
Market Sentiment
Consumer sentiment in March 2026 is best characterized as cautiously opportunistic on the buyer side and increasingly realistic on the seller side. TRREB's 2026 Market Outlook (released February 2026) found "cautious consumer sentiment across the GTA" with buyers attuned to improved affordability but hesitant about trade and economic uncertainty.
The data bears this out: sales volume is recovering (+1.7% YoY in the GTA) but the pace is measured, not frenetic. Buyers are taking longer to decide — evidenced by the 45–47-day average days-on-market in Hamilton — and are asking more questions, requesting more conditions, and walking away from overpriced listings.
Sellers, in turn, are accepting market realities. Hamilton's sale-to-list ratio of 97.2% is healthy but no longer the 101–103% seen during the 2021 peak. In Waterloo Region, the balanced 2.9-month supply means well-priced properties still attract competition, while overpriced listings sit. The practical implication: pricing discipline and market knowledge are the two most decisive factors for sellers in today's environment.
"The early signal is clear enough: spring 2026 is shaping up to be more active than spring 2025. The market is not booming, but it is turning. Whether you are buying, selling, or simply trying to understand what your home is worth right now, the smartest move is a conversation grounded in current data rather than last year's assumptions."
— Market analysis commentary, TanTeam Real Estate Group, April 2026 (citing TRREB March 2026 data)Forward Outlook
The emerging consensus from analyst and board data: March 2026 is likely near the bottom of this price cycle for most Southern Ontario markets. The combination of recovering sales volume, tightening new listings, and two consecutive months of MoM HPI stabilization in the GTA points to a market that is gradually rebalancing toward sellers as 2026 progresses.
CREA's national forecast projects 509,479 sales nationally — up 7.7% over 2025 — while Ontario markets are expected to hold flat to modest gains. The key variable remains consumer confidence tied to trade and interest rate developments. Positive movement on either front could catalyze a more rapid recovery in both volume and price.
For buyers: the window of maximum leverage is now, and it is narrowing. For sellers: proper pricing and presentation remain the decisive factors in a market where buyers are sophisticated and patient.
Work With an Expert
In a market defined by hyper-local variation — where Cambridge is gaining while Hamilton corrects, and where a 0,000 pricing error can mean 60 days on market versus 7 — working with a knowledgeable, data-driven agent is not optional. It is the difference between a successful transaction and a missed opportunity.
Real Estate Agent · Royal Canadian Realty

I’m Mani Verma, a real estate salesperson with Royal Canadian Realty, helping clients buy, sell, and invest across Cambridge, Kitchener, Waterloo, Ayr, and surrounding areas. I’m committed....
Market Snapshot Regions FAQ Service AreasCall 647-879-0484Market Report · July 2026Southern Ontario Real Estate: Balanced to Buyer-Leaning"Prices remain below July 2025 levels across most
May 2026 Market ReportSouthern Ontario Real Estate Market ReportWhat's Really Happening Across the GTA, Hamilton & Waterloo Region — by Mani Verma, Royal Canadian RealtyHome Sales (GTA)5
−4.9% GTA Average Price (YoY) $1,051,969 avg — April 2026+7% GTA Sales Volume (YoY) 5,946 transactions in April5.2 mo National Inventory Near balanced conditions nationallyApril 2026
📊 Market Report · March 2026Southern OntarioReal Estate ReportWhat's Really Happening Across the GTA, Hamilton & Waterloo Region — A comprehensive, data-driven analysis for,

The listing data displayed is deemed reliable but is not guaranteed accurate by CREA®. Data last updated on September 21, 2026 3:01 PM UTC The trademarks REALTOR®, REALTORS®; and the REALTOR® logo are controlled by The Canadian Real Estate Association (CREA®) and identify real estate professionals who are members of CREA®. Used under license. The trademarks MLS®, Multiple Listing Service® and the associated logos are owned by The Canadian Real Estate Association (CREA®) and identify the quality of services provided by real estate professionals who are members of CREA®. Used under license.
Show More...
 Data provided by the Ontario Regional Technology & Information Systems. The information is deemed reliable, but is not guaranteed. Not intended to solicit buyers or sellers, landlords or tenants currently under contract.
The trademarks REALTOR®, REALTORS® and the REALTOR® logo are controlled by The Canadian Real Estate Association (CREA) and identify real estate professionals who are members of CREA. The trademarks MLS®, Multiple Listing Service® and the associated logos are owned
by CREA and identify the quality of services provided by real estate professionals who are members of CREA. Used under license.
REALTOR® contact information provided to facilitate inquiries from consumers interested in Real Estate services. Please do not contact the website owner with unsolicited commercial offers.
Show More...
Data provided by the Ontario Regional Technology & Information Systems. The information is deemed reliable, but is not guaranteed. Not intended to solicit buyers or sellers, landlords or tenants currently under contract.
The trademarks REALTOR®, REALTORS® and the REALTOR® logo are controlled by The Canadian Real Estate Association (CREA) and identify real estate professionals who are members of CREA. The trademarks MLS®, Multiple Listing Service® and the associated logos are owned
by CREA and identify the quality of services provided by real estate professionals who are members of CREA. Used under license.
REALTOR® contact information provided to facilitate inquiries from consumers interested in Real Estate services. Please do not contact the website owner with unsolicited commercial offers.
Show More...
