

Market Snapshot Regions FAQ Service AreasCall 647-879-0484Market Report · July 2026Southern Ontario Real Estate: Balanced to Buyer-Leaning"Prices remain below July 2025 levels across most
Executive Summary
Southern Ontario is not one single market right now — it is a cluster of micro-markets with different levels of demand, inventory, and pricing power. In April 2026, the broad pattern across the GTA, Hamilton-Burlington, and Waterloo Region was clear: buyers had more choice than they did during the pandemic years, but conditions varied sharply by property type and location.
Is Southern Ontario in a buyer's market in April 2026? Yes, in many segments — but not all. The clearest buyer advantage is in condos and weaker suburban pockets. Detached homes in family-oriented, well-located areas remain more resilient.
GTA Market Conditions
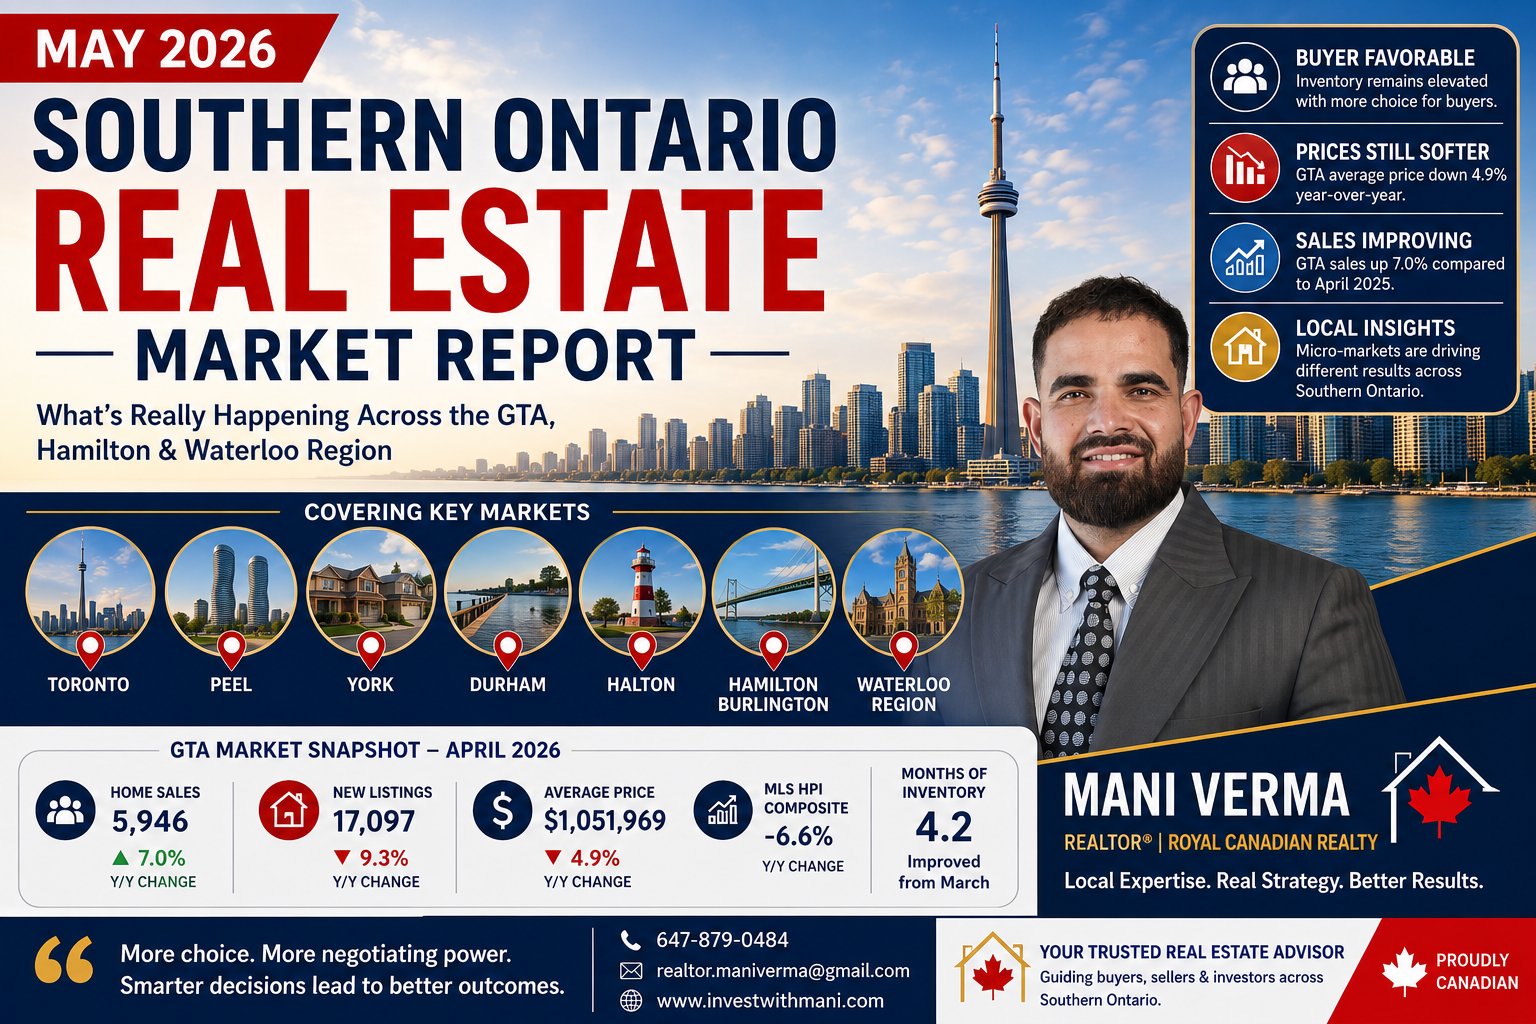
The April 2026 GTA housing market shows a picture that is slightly firmer on sales but still softer on prices. Sales rose 7.0% year over year to 5,946. New listings fell 9.3% to 17,097. The average selling price slipped 4.9% to $1,051,969, while the MLS HPI Composite fell 6.6%.
| GTA Metric | April 2026 | Year-over-Year Change |
|---|---|---|
| Home Sales | 5,946 | +7.0% |
| New Listings | 17,097 | −9.3% |
| Average Price | $1,051,969 | −4.9% |
| MLS HPI Composite | — | −6.6% |
| Months of Inventory | 4.2 | Improved from March |
This is important context for both buyers and sellers: "more sales" does not automatically mean "higher prices." The spring market became more active, but negotiating power still leaned toward buyers in many product segments — especially where inventory is deeper. The full April 2026 TRREB report and national CREA stats back this up across the province.
Toronto & the 416
The 416 freehold segment held up better than some 905 areas. Condos remained highly sensitive to financing costs and buyer caution. Central freeholds can still attract competition when pricing is realistic, while many condo segments remain firmly in buyer's market territory. Read the full Toronto housing market update for April 2026 and the April 2026 Toronto real estate market report for deeper neighbourhood-level breakdowns. In practical terms, location within the city often matters more than broad headline averages.
Peel & York Region
These areas bridge Toronto pricing with suburban space and family demand. Buyers in Markham, Vaughan, Aurora, Newmarket, and King City should pay close attention to lot size, renovation quality, and commuting convenience — these features are driving price dispersion more than regional averages. In Peel, Mississauga and Brampton continue to offer opportunities for buyers who can move quickly on well-priced listings. See the broader GTA housing breakdown on LinkedIn for additional context on the 905 belt.
Hamilton-Burlington & Brantford
Hamilton Average Price
$777,612
▼ 1.7% year-over-year
506 sales · 1,300 new listings
Hamilton-Burlington Benchmark
$737,600
▼ 7.5% year-over-year
Sales-to-listings ratio: 39% — buyer-leaning
Months of Supply
4.6
Elevated — buyer-leaning
Condo apartments down 16.0% YoY
Within this region, Burlington remains more expensive and more vulnerable to corrections when demand slows, while Hamilton offers relatively more affordability and stronger rental yield logic for investors. Full stats are available from the Realtors Association of Hamilton-Burlington (RAHB) and WOWA's Hamilton housing market tracker. The strongest market psychology is clear: buyers know they have time, and sellers must justify price with condition, location, and move-in appeal.
| Metric | April 2026 | Change |
|---|---|---|
| Hamilton Sales | 506 | — |
| Hamilton New Listings | 1,300 | — |
| Sales-to-Listings Ratio | 39% | Buyer-leaning |
| Months of Supply | 4.6 | Elevated |
| Hamilton Benchmark | $737,600 | −7.5% |
Waterloo Region Update
Waterloo Region remains one of the most balanced markets in Southern Ontario. Across the region, 561 homes sold at an average price of approximately $754,433, with homes taking roughly 25 days to sell. Sales rose 14.0% month-over-month, and new listings rose 27.8% — overall inventory sits at 3.6 months of supply, consistent with an active but not overheated market. See the full Waterloo Region market statistics for April 2026 and the Waterloo Region real estate market update with price trends.
Waterloo Region's internal split matters: Detached homes were the strongest segment. Semi-detached homes were comparatively tight. Condos had the loosest supply at 8.6 months, creating clear negotiating room for buyers. Cambridge, Kitchener, and Waterloo are not moving identically — treat each city as its own micro-market. Official stats are published by the Waterloo Region Association of Realtors (WRAR).
| Metric | April 2026 | Change |
|---|---|---|
| Home Sales | 561 | −7.6% YoY |
| New Listings | ~1,388 | Higher than last year |
| Average Price | ~$754,433 | ~−3.8% |
| Days on Market | 25 days | Steady |
| Inventory | 3.6 months | Balanced |
Durham & Halton
These markets have often attracted buyers priced out of Toronto, but in April 2026 they still reflected a cautious, data-driven environment rather than a bidding-war market. Halton — particularly Oakville and Burlington — continues to trade at a premium to the broader region, a premium now more vulnerable when borrowing costs remain restrictive. In Durham, affordability, commute access, and housing diversity still support demand, but buyers are increasingly selective about condition and price. Province-wide context is available from CREA Statistics and the CBC's April 2026 national home sales coverage.
Housing Type Performance
Across Ontario, price declines varied significantly by housing type. OREA benchmark data shows detached homes are proving most resilient; condos are under the greatest pressure. This pattern is consistent across all markets covered.
Key Market Drivers
Interest rates: The Bank of Canada held its policy rate at 2.25% on April 29, 2026 — keeping borrowing conditions steady rather than providing an immediate rate catalyst. This helped keep buyers active, but not aggressive, because affordability remains stretched relative to pre-2022 norms. The Bank of Canada press release archive provides the full monetary policy context.
Immigration & policy: Canada's 2026–2028 immigration levels plan continues to support long-run housing demand, even as temporary resident growth is being reduced. Ontario's expanded HST rebate for eligible new homes signed after April 1, 2026 is intended to stimulate new construction and improve affordability for qualifying buyers. First-time buyers may also benefit from the First-Time Home Buyers GST/HST Rebate.
"More choice. More negotiating power. Smarter decisions lead to better outcomes."
Why Work With Mani Verma
In a market like this, Mani's value is not hype — it's interpretation, pricing discipline, and local execution. Buyers benefit from real-time market insight because the right offer strategy in a Toronto condo, Hamilton detached, or Waterloo townhouse segment can differ materially, even in the same month. Explore Mani's approach at investwithmani.com or call directly at 647-879-0484.
- Reads local supply and demand at the neighbourhood level — not just regional headlines from TRREB or CREA
- Calibrates offer and listing strategy to current inventory, days on market, and price sensitivity
- Supports buyers with comparison-based guidance — patience often saves money in today's buyer-leaning Ontario market
- Helps sellers build a pricing plan that reflects current buyer leverage and segment-specific competition
- Delivers transparent, data-driven advice suited to April 2026's conditions — serving clients across Mississauga, Markham, Kitchener, and Hamilton

 Data provided by the Ontario Regional Technology & Information Systems. The information is deemed reliable, but is not guaranteed. Not intended to solicit buyers or sellers, landlords or tenants currently under contract.
The trademarks REALTOR®, REALTORS® and the REALTOR® logo are controlled by The Canadian Real Estate Association (CREA) and identify real estate professionals who are members of CREA. The trademarks MLS®, Multiple Listing Service® and the associated logos are owned
Data provided by the Ontario Regional Technology & Information Systems. The information is deemed reliable, but is not guaranteed. Not intended to solicit buyers or sellers, landlords or tenants currently under contract.
The trademarks REALTOR®, REALTORS® and the REALTOR® logo are controlled by The Canadian Real Estate Association (CREA) and identify real estate professionals who are members of CREA. The trademarks MLS®, Multiple Listing Service® and the associated logos are owned
